Read altitudes of pixels of DEM GeoTIFF with Python GDAL module
Bas den Brok - mapping course
Quick notes to remember what needs to be done
Understanding of some Python required.
We have a DEM GeoTIFF file and want to read altitudes of single pixels and import values in Python. The file
looks like this in QGIS:

In this specific case I used Python version 3.6.13 and GDAL installed in an Anaconda3 environment
where I installed GDAL and ran the program in a Jupyter Notebook (version 6.4.3). This is the code:
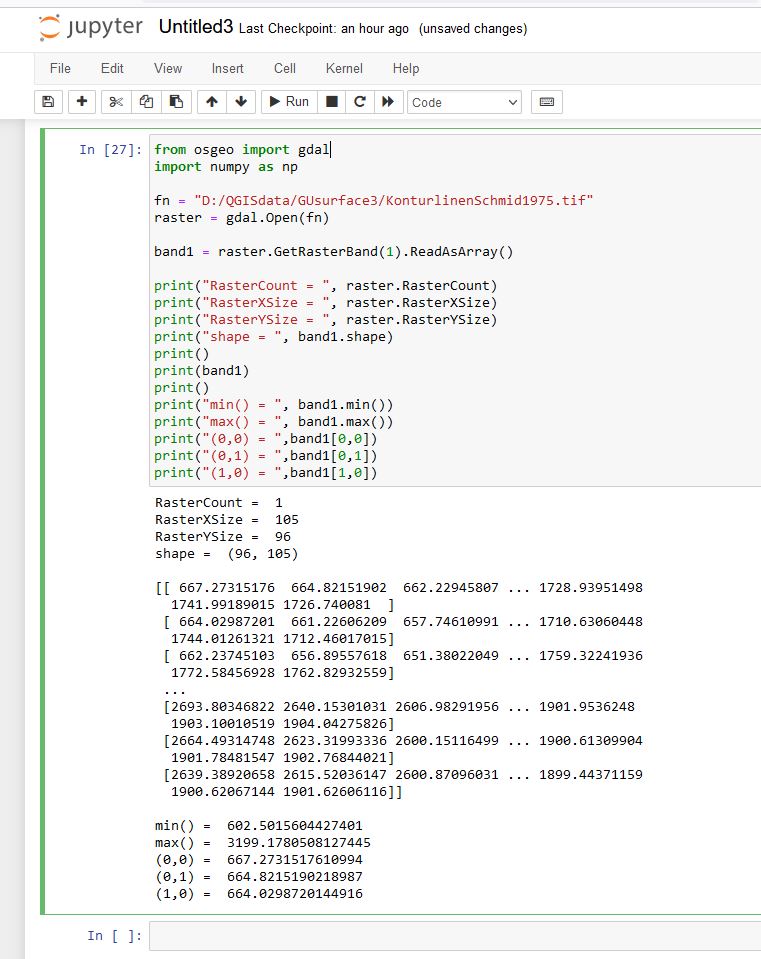
You can see that there is only one raster of 105 by 96 pixels in this GeoTIFF
and that we imported it in a 105 times 96 Numpy array band1. Part of the arary
is depicted. You can see that the value of the altitude at (0,0) in the upper left corner of the array
equals 667.2732... m and the next one to the right (0,1) equals 664.8215... m etc.
Information about the projection and about the transformation (CRS to pixels) used:
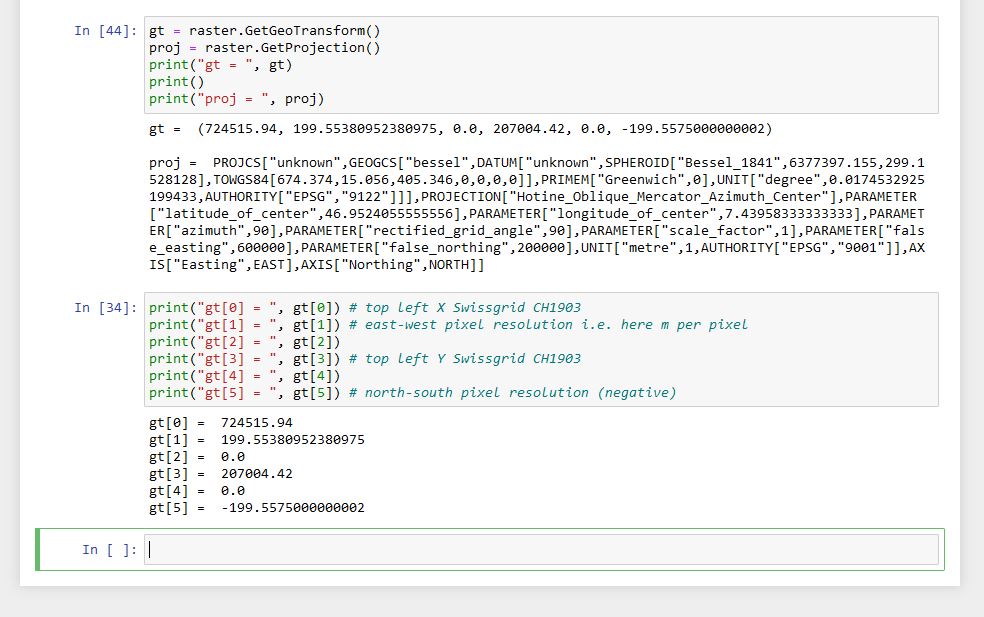
You see we habe a resolution of ca. 200 m per pixel here.
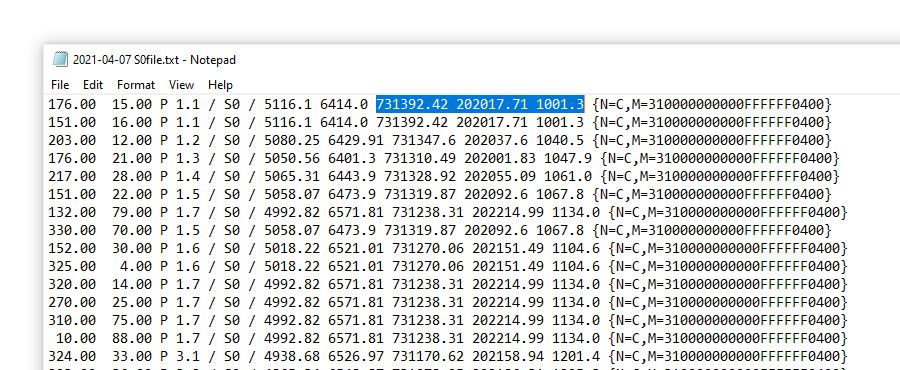
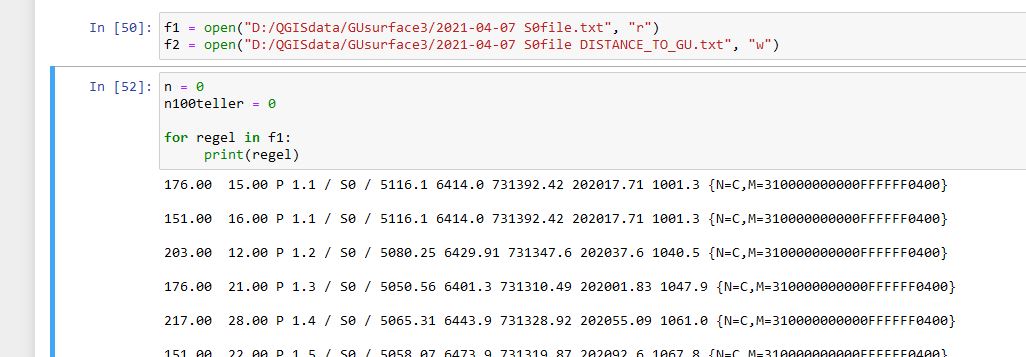
We want to know the vertical distance between single outcrop points and the overlying Glarus thrust as described by the above GeoTIFF. The outcrops are in the txt file 2021-04-07 S0file.txt in the format as here below.
Relevant are the three values marked in blue: the X and Y coordinate (Swissgrid CH1903) and the altitude of the outcrop in m
We will do the calculation for each outcrop starting like:
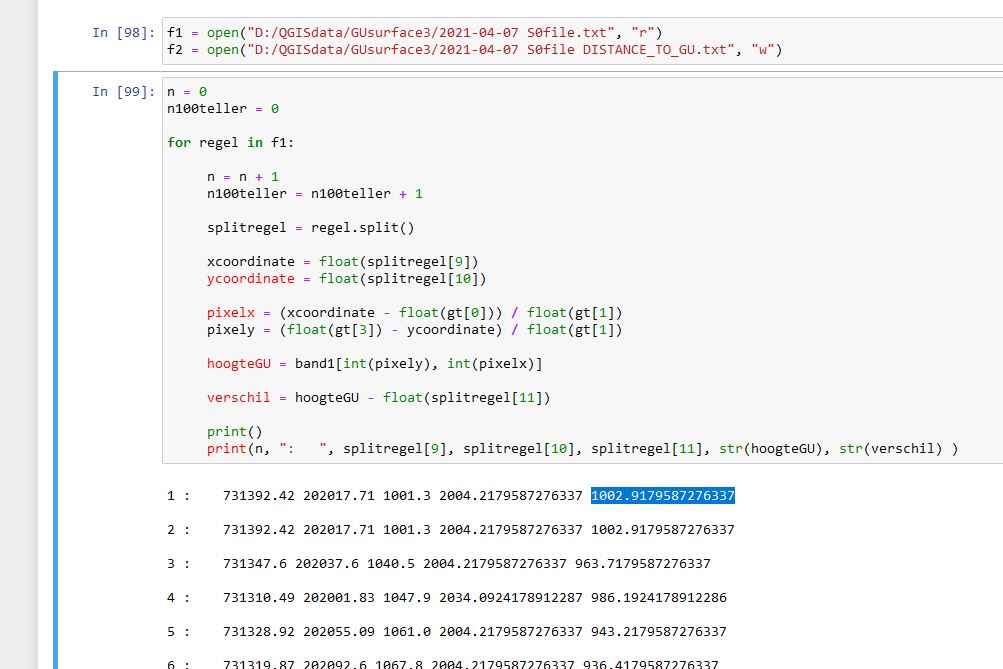
Splitting up the txt lines in single pieces where we are interested in
splitregel[9] (X coordinate), splitregel[10] (Y coordinate), splitregel[11] (elevation):

Now it is easy to calculate the difference in altitude (verschil) between the outcrop (splitregel[11])
and the altitude of the Glarus thrust (hoogteGU). For the first outcrop it is 1002.91... m (marked blue):
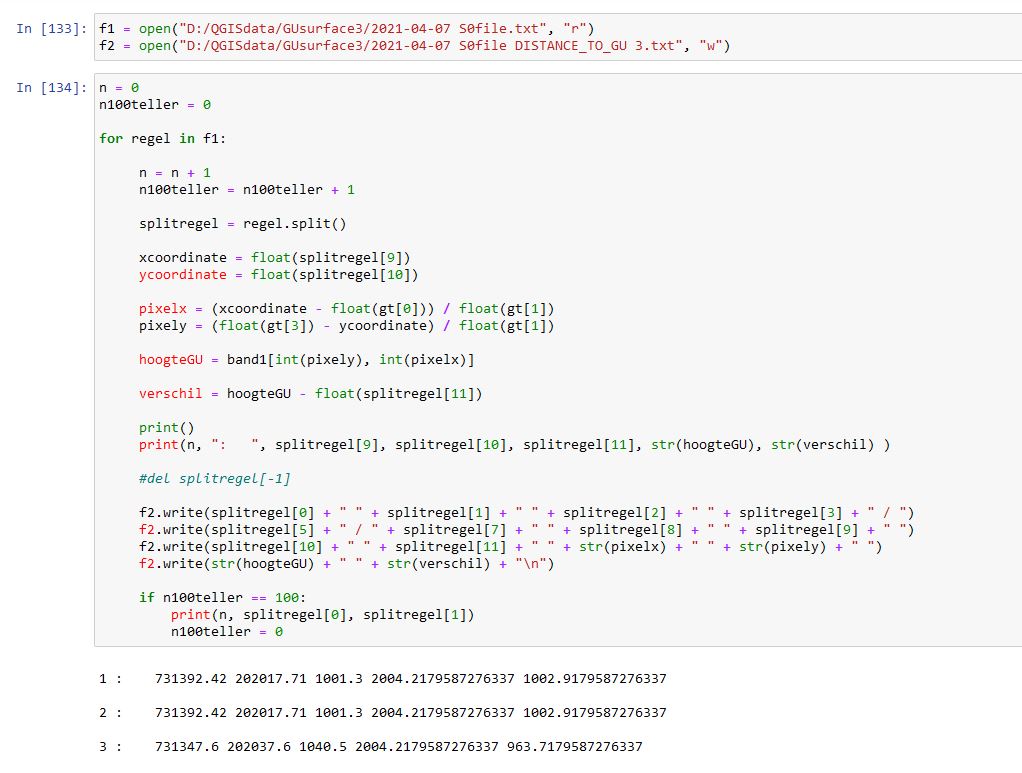
Here below is the full code. This is the file:
berekenenvanhoogteverschil3.ipynb (not for use! only to help you write your own code.)
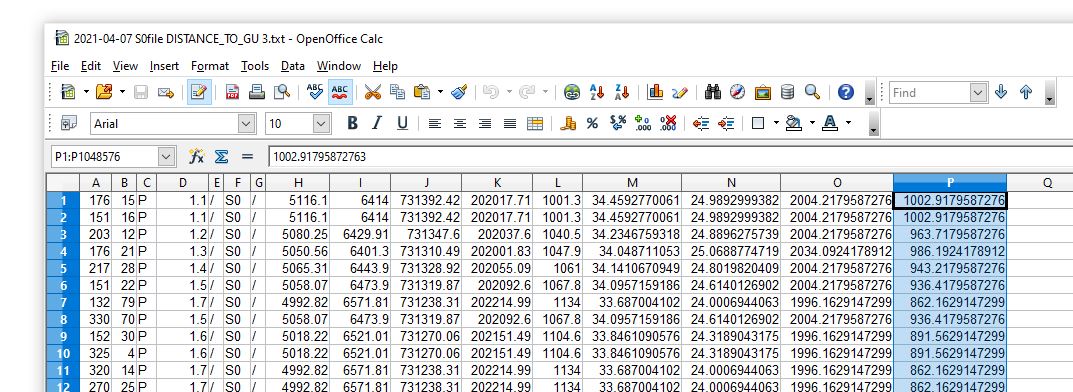
The final txt file openened in OpenOffice Calc looks like here below, where the differences in altitude
are in column P (marked blue). Swissgrid CH1903 X coordinate (column J), Swissgrid CH1903 Y coordinate
column K), altitude of outcrop (column L), X coordinate of GeoTIFF (column M), Y coordinate of GeoTIFF
(column N), Altitude of DEM (column O) and difference in altitude (column P).
